In Lesson 9-I, we used Excel's built-in model fitting to find exponential models for given data. But what's Excel really doing?
Exponential Least Squares
As in Lesson 2, Excel isn't just guessing. Maybe, like in Lesson 2, Excel is minimizing the sum of squares? Let's see!
Recall the Raleigh population data:
| years since 1900 | Raleigh |
| 0 | 13643 |
| 10 | 19218 |
| 20 | 24418 |
| 30 | 37379 |
| 40 | 46879 |
| 50 | 65679 |
| 60 | 93931 |
| 70 | 122830 |
| 80 | 150255 |
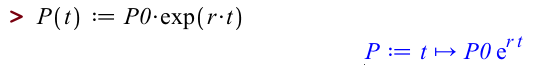
We expect (because this is a growing population) that these data should basically fit a function of the form

Like we did in Lesson 2, we could decide that the first data point (for the year 1900), is somehow especially correct, and just declare that  . That means we'd only need to figure out what
  is. But there's really no reason to think the census in the year 1900 was any more correct, or that nothing weird happened in 1900 to make the population lower or higher than it "should" have been otherwise.
As in Lesson 2, we'll consider the sum of squares quantity. Use  to denote the actual measured population corresponding to
  , and
, and  the predicted population by the model
  . Then the sum of squares should be:

which for us works out to:

Observe that this is just a function of  and
and  , so we can minimize using the two-variable optimization technique from Lesson 4.
First, we enter  . To do this, let's tell Maple about our model in general:
Then we can use this to enter :
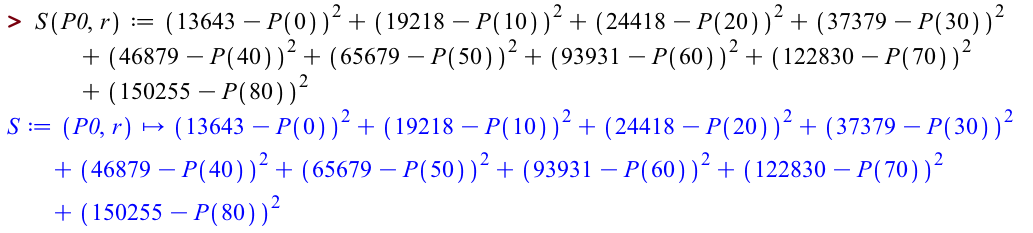
Let's verify that that's correct:
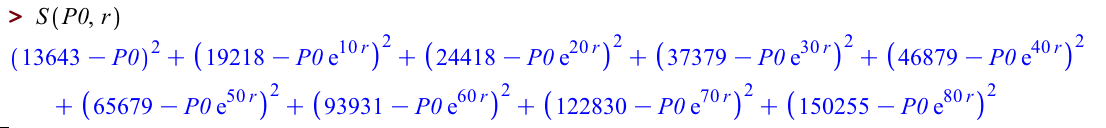
Now we need to solve the system

or in Maple-speak:
[>solve({diff(S(P0,r),P0)=0,diff(S(P0,r),r)=0})
which returns a mess too great to even screenshot.
We're interested in a numerical value, so let's try that again with an evalf:

There are two solutions. The first one has  , which isn't reasonable -- then we'd have
  . It also has given as a complex number (as indicated by the capital I). So probably the first solution isn't what we're interested in. The second solution is

which means a model of

(after a bit of rounding). Recall from Lesson 9-I that the model Excel fitted for these data was

as reported by Trendline, and

as reported by the log-trick. To summarize in table form:
| method | trendline | log trick | least squares | actual data |
| model | |
|
|
- |
| growth rate | 3.07% | 3.07% | 2.862% | - |
| initial population | 13696 | 13969 | 15789 | 13643 |
Here's a plot of all three models, together with the given data. The least-squares model is in red; Trendline's model is in blue; the log-trick model is in green.
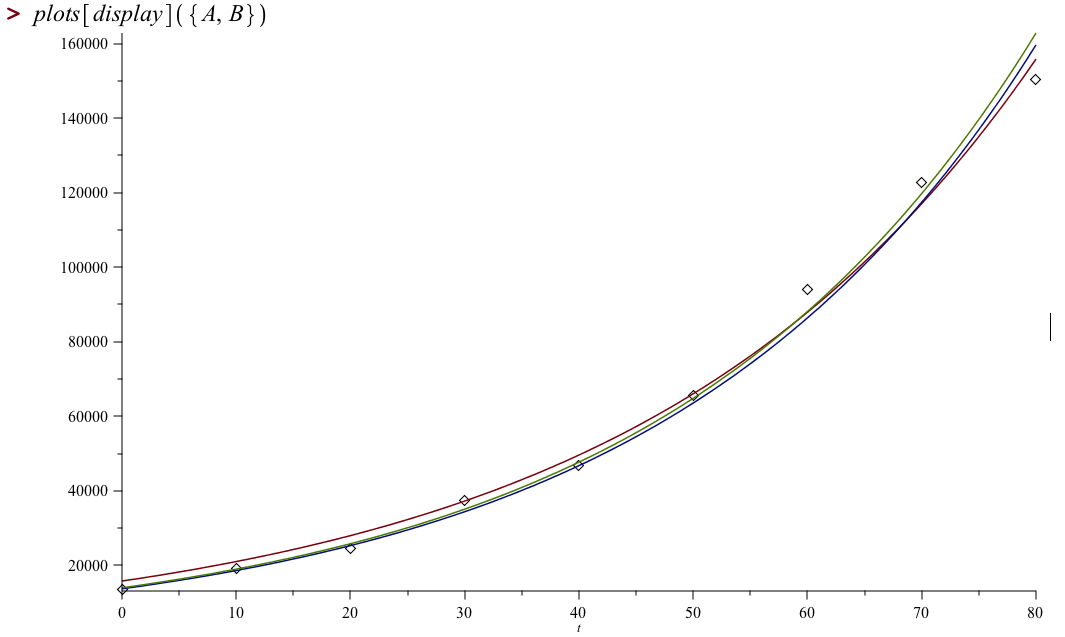 This plot was created in Maple; the code is:
[>with(plots)
[>leastsquares(t):= 15789.60744*exp(0.02862048031*t)
[>trendline(t):=13696*exp(0.0307*t)
[>logtrick(t):=13969*exp(0.0307*t)
[>A := plot({leastsquares(t), logtrick(t), trendline(t)}, t = 0 .. 80)
[>B := pointplot([0, 10, 20, 30, 40, 50, 60, 70, 80], [13643, 19218, 24418, 37379, 46879, 65679, 93931, 122830, 150255])
[>plots[display]({A, B})
We can see that, whatever Excel is doing, it's not using the least-squares method to compute its exponential-of-best fit.
Some Other Least Squares Fits
We have decent reason to think these data are growing exponentially, but at first glance we might imagine the curve that the data points trace is a parabola. Which parabola would fit best? Let's ask Maple!
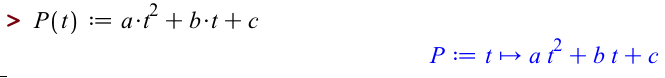
A parabola is the graph of a quadratic function

so there are now three parameters to fit. Let's update Maple on this:
Then the sum of squares is now a function of  :
:
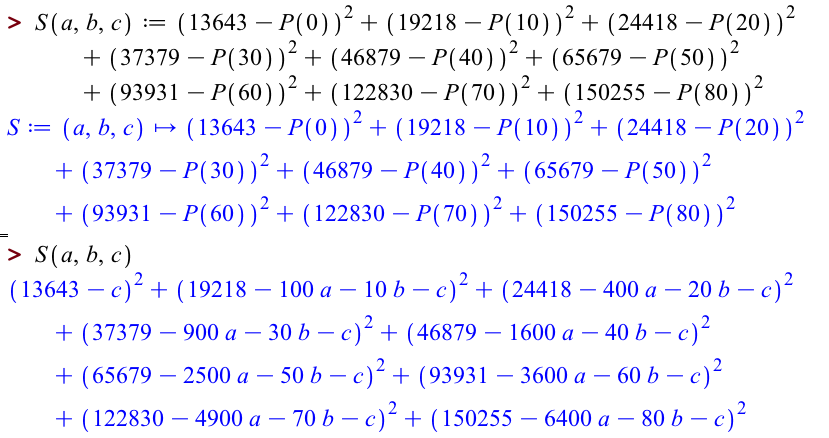
so we need to solve a system involving three variables,

which Maple can easily do:
![]()
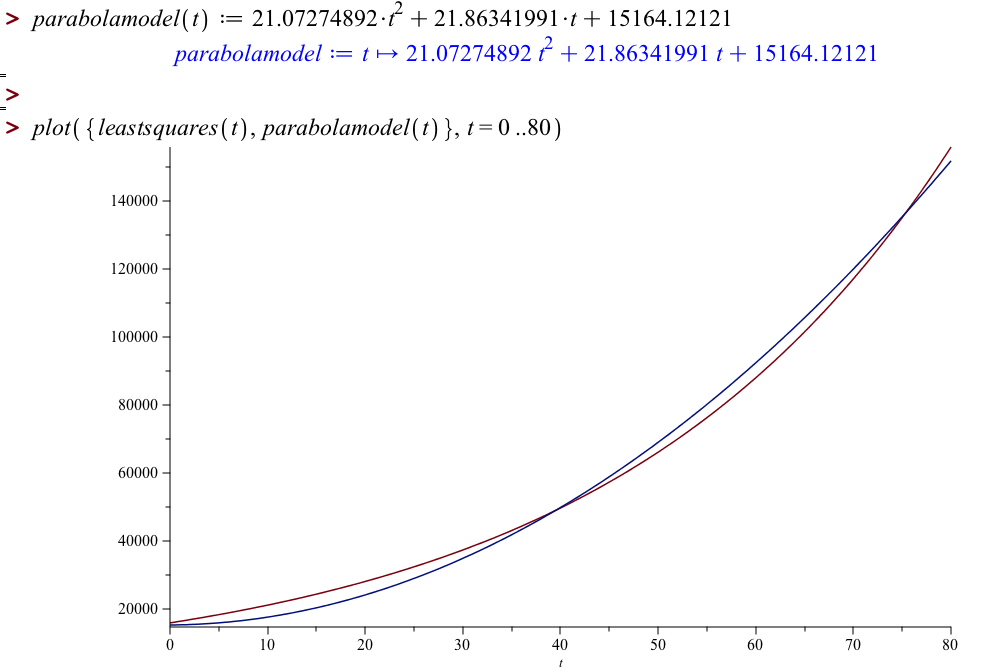
The resulting model doesn't look too different from the least-squares model in the years 1900-1980 (the least squares model is in red; the parabolic model is in blue):
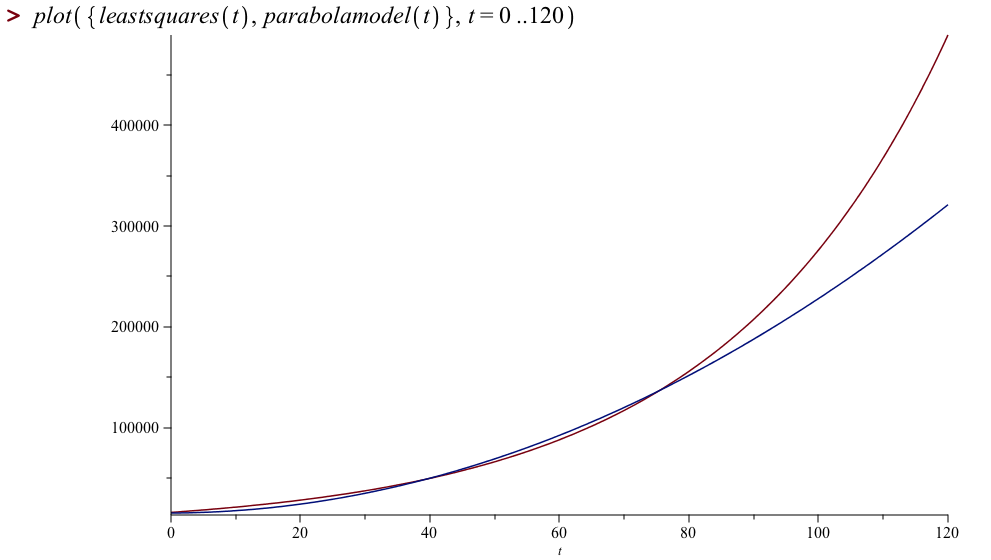
but you can see that they make very different predictions if we look out to the year 2020:
Takeaways/Deliverables
To say you've successfully completed this lesson, you should be able to do the following:
- Use Maple to find a least-squares exponential to fit given data.
- Interpret the parameters of an exponential fitting given data.
- Use Maple to find a least-squares quadratic to fit given data.
- Use Maple to plot your least-squares exponential and least-squares quadratic models on the same axes as the given data for comparison.