A clothing firm can manufacture suits at $20 per suit. The initial or startup cost of the equipment is $10,000. The market price per suit was initially $80 per suit, the selling price. But as more suits were sold, and the market became saturated, the demand dropped. In order to keep selling suits, the firm had to drop the price. The retailer noticed a trend in the declining market price: for every additional suit sold, the price had to be dropped by about 5 cents ($.05).
Putting ourselves in the firm's shoes, one objective is to find the break-even number of sales: where revenue is equal to cost. If the sales are too small, the initial cost will make the total cost larger than the revenue. In the other extreme, if the sales are too large, the price per suit will be very small and the revenue will be too small to realize a profit. Ideally, we would also like to know the number of sales where the profit will be a maximum.
The Mathematical Model
Profit is revenue minus cost:

To make such an equation useful, we need to find formulas for the revenue and the cost in terms of the number of suits produced.
Revenue is straightforward:
![revenue = [price\ per\ suit ] \times [number\ of\ suits\ sold]](https://ma132.wordpress.ncsu.edu/wp-content/ql-cache/quicklatex.com-b4e84d9cb9089e887cc0283a8207ac14_l3.png "Rendered by QuickLaTeX.com")
In applying math to the real world, we have to translate concepts to symbols and back again. It can be very helpful to take an intermediate step and construct word equations like the ones displayed here for profit, revenue, cost, and production cost.
The point is to recognize that equations are "just" another kind of sentence.
Costs come in two kinds: fixed costs, such as the initial investment to build the suit factory, worker salaries, property taxes, electricity for lighting in the showroom, etc, which do not depend on how many suits are produced and sold; and variable costs such as material for each suit, packaging, which are required on a per-suit basis.
![cost = [production\ cost\ of\ suits] + [fixed\ costs]](https://ma132.wordpress.ncsu.edu/wp-content/ql-cache/quicklatex.com-db3583756bd33b0021d597d6cc57d57f_l3.png "Rendered by QuickLaTeX.com")
We can further observe that the variable production cost looks something like:
![[production\ cost\ of\ suits] = [cost\ to\ make\ each\ suit] \times [number\ of\ suits\ made]](https://ma132.wordpress.ncsu.edu/wp-content/ql-cache/quicklatex.com-fa1bfa02f029344b36be1577814d4472_l3.png "Rendered by QuickLaTeX.com")
Now let's make our word equations into symbolic equations. We'll pick some variables to represent the quantities we were previously representing with phrases. To do this, we need to identify the independent variables -- the quantities that control everything else.
A dependent variable is one that depends on another -- for example, the cost of producing suits depends on how many suits are produced. An independent variable is one which can be chosen (for example, we can choose to produce however many suits we want).
Here, there are two: the number of suits produced and the number of suits sold. Since we have no reason to stockpile suits, we will assume that we're going to sell every suit we produce. That is, we assume
![[number\ of\ suits\ sold] = [number\ of\ suits\ made]](https://ma132.wordpress.ncsu.edu/wp-content/ql-cache/quicklatex.com-55de8fddb098938f701e6ce8568fdc40_l3.png "Rendered by QuickLaTeX.com")
and we'll call this common number x. Let's make a list of our other variables. They all depend on x, so we write them as functions of x:
| symbol | meaning |
 |
number of suits sold / number of suits made |
 |
cost to make suits |
 |
revenue from selling suits |
 |
profit from making and selling suits |
 |
price per suit, if suits have been sold |
We could have called our independent variable whatever we want, but it's traditional to use x to denote the independent variable when there's only one. For dependent variables, it can be helpful to use the first letter of the word or phrase the variable stands for. The only rule is: don't reuse letters. So if you use P for "profit", you can't also use P for "price". (If you did use P for both, how would know which was which?)
Now we are ready to translate the information given in the initial problem statement into some equations. Our ultimate goal is to get a formula for P(x). For each word equation, we'll just replace the words with the corresponding symbols.

Now we use the information about how price responds to the increase in supply when we produce more suits:
![revenue = [price\ per\ suit ] \times [number\ of\ suits\ sold]\\ R(x) = S(x)\cdot x\\R(x)=(80-.05x)\cdot x](https://ma132.wordpress.ncsu.edu/wp-content/ql-cache/quicklatex.com-0fb80fbb139a5d44d978e0d79d2233e3_l3.png "Rendered by QuickLaTeX.com")
Now let's handle costs:
![cost = [production\ cost\ of\ suits] + [fixed\ costs]\\ cost = [cost\ to\ make\ each\ suit] \times [number\ of\ suits\ made]+[fixed\ costs]\\ C(x)=20x+10000](https://ma132.wordpress.ncsu.edu/wp-content/ql-cache/quicklatex.com-58a42ce270164bdc30f3f5647a61fae3_l3.png "Rendered by QuickLaTeX.com")
Putting it together, we obtain:

Some Mathematical Methods
Mathematically, the function  is a quadratic with a negative leading coefficient. Its graph is a parabola which opens downward. That means its values will be positive only for a certain range -- if we produce too many suits, the price we can demand will be too little to offset the production cost; if we produce too few, we will not overcome the initial outlay to buy machinery, build the factory, etc. There should be two break-even points: one where we transition from loss to profitability, and one where we transition from profitability to loss. There should also be a sweet spot, somewhere between the two break-evens, where profit is maximized. We'll discuss some mathematical methods to find these production points, and how to use computational tools to carry out these methods:
- Make a table of values (x,P(x)) (a numerical method)
- Graph the function P(x) (a graphical method)
- Use calculus to optimize P(x) (an analytic method)
Tabular Method (Excel)
We'll use Excel to compute a table of values of P(x).
Instructions
- Open a spreadsheet. Label cell A1 with x and cell B1 with P(x).
- In cell A2 type 0. In cell B2 type
= - .05*A2^2+60*A2-10000
- In cell A3 type 100. In cell B3 type
= - .05*A3^2+60*A3-10000
- Select cells A2:B3; click in the lower right corner of cell B3 and drag down to cell B14.
- Check each cell in column B to make sure that the formula in cell B4 contains A4; the formula in cell B5 contains A5; etc.
- In column C, enter a formula which represents the profit function if the manufacturing cost for each suit were $25 (rather than $20).
Examining this table, we can see where the break-even points are (just look for a zero appearing on in column B), and where the maximum profit point is (just look for the largest value in column B).
Graphical Method (Excel)
It is often much more convenient, and often much more revelatory, to graph information than to display it in a table. (Among other reasons, the part of your brain which processes and interprets visual information is older, larger, and more-practiced than the part which you use for understanding and manipulating numbers and algebraic symbols.)
Let's get Excel to draw us a graph.
- Select cells A2:C14.
- Click the Insert tab, then click the Scatter Plot icon and select "Scatter with Smooth Lines":

- Find the break-even points and profit-maximization points for each scenario using the graph.
Analytic Method (Maple)
Both the tabular and graphical methods are approximate. In the $20 cost-per-suit scenario, it sure looks like we should produce 600 suits to maximize our profit, but we'd like to be sure -- after all, money's on the line!
Recall from calculus that if a function has a maximum, its derivative there must be zero. So to find the maximum of the profit function, we should differentiate it, and solve for where the derivative is zero.
We could do this by hand (as you learned to do in Calculus I. But this is not a calculus I course! Instead, we'll make the computer handle the drudgery for us (even though in this case, the drudgery wouldn't be so drudgerous).
Excel won't do this, because it only works with numbers, whereas differentiation requires us to work symbolically. So we'll have to fire up Maple.
Using Maple to Derive the Profit Function
 We'll have our first experience with getting it to derive the formula for profit that we did by hand, above. (Perhaps your algebra skills are a bit rusty, or your eyes glazed over, and you didn't follow it anyway.)
When you open Maple, click on "New Worksheet". You'll see a blank worksheet with a cursor that looks like this: [>. Any commands you type will appear in black italic font; the output that Maple returns will be in blue.
a screencast of this part of the Lesson
Roughly speaking, we'll tell Maple absolutely everything we wrote for ourselves above, in our derivation of the formula for the profit function. To let Maple know we're defining something, we use the symbol :=. Maple treats the symbol x as a variable automatically, and it also treats any string of letters (just letters, no punctuation or spaces) as a variable. Let's tell Maple what the price, revenue, cost, and profit functions are.
Since Maple lets us use any string of letters as a name, let's call our profit function profit, our cost function cost, etc. To define a function, we type it more or less the ordinary mathematical way:
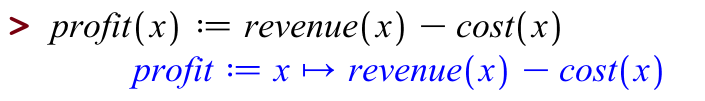
Let's observe a couple of things. First, Maple echoes your definitions back to you. This is so you and Maple understand each other and don't miscommunicate. Maple's report back to us says that "profit" is a thing that takes in something called and gives back  .
.
Now let's enter the other word equations:
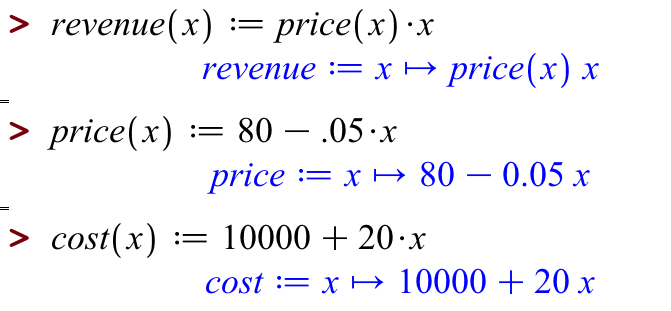
To enter multiplication, type *; Maple will immediately render this as a dot.
Now let's ask Maple what profit is: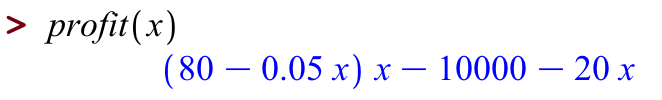 That doesn't quite like the answer above, but we can use the commands simplify:
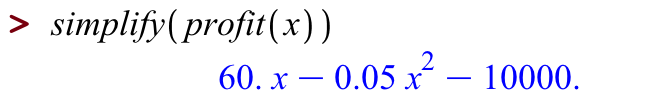
Notice how we let Maple handle all of the algebra for us!
Plotting in Maple
Now that Maple knows what the profit function is, we can plot it, as follows. Try:
[> plot(profit(x), x=0..1200)
which plots the function profit for all values of x between 0 and 1200.
Differentiating in Maple
Since we remember from Calculus I that the maximum of a function occurs where the derivative of that function is zero, we'd like to find the derivative of our profit function.
This command
[> derivativeofprofit(x):=diff(profit(x),x)
tells Maple to define a new function called derivativeofprofit, which is the derivative of the function  .
.
Solving in Maple
Now that we have the derivative of the profit function, we can find where that derivative is equal to zero. Lucky for us, Maple has a very nice command called solve, which works like this:
[> solve(derivativeofprofit(x)=0,x)
We can almost read this out loud: we asked Maple to solve the equation "derivative of profit is zero", for x.
Or we could roll both differentiating and solving into one command:
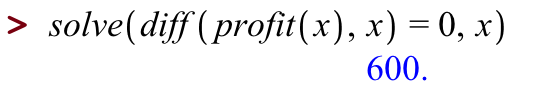
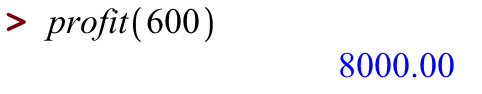
That's the number of suits we should sell to maximize our profit -- what profit do we make at this production-and-sales level? Again, let's ask Maple:
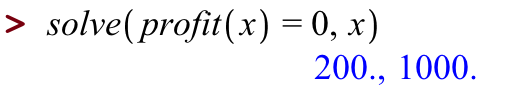
We could also use Maple's solve command to find the breakeven points, that is, to solve for where profit is equal to zero.
Concluding Comments
When building and using a mathematical model, it is important to keep in mind the assumptions you are making. Let's articulate a few assumptions we have made which seemed reasonable at first but which don't really hold up on further reflection:
- We assumed that everything was independent of time. That is, the cost of making a suit never changes; the price we can ask for a suit never changes (except in response to how many suits we offer).
- We assumed that the fixed costs were laid out all at the beginning: we built one factory and bought all the machinery at once. This is not quite reasonable: a particular factory can only handle so many suits per month (say 10,000), and then we have to lay out an entirely new factory. It is also the case that equipment wears out and needs to be replaced.
- We have assumed that the price we can demand responds linearly to the supply we introduce to the market. This is unreasonable on two grounds:
- First, we're probably not the only firm producing suits.
- Second, the price we can demand is definitely not going to be a linear function of the suit supply. If this were true, if we produced enough suits, the market price would be negative, that is, we'd have to pay people to take the suits.
There are surely some other ways in which our model is too simplistic; see if you can come up with some. Nevertheless, a good way to proceed is to start with a simple model built on shaky assumptions, get it working, then refine that model to address the flaws you know exist.
Takeaways/Deliverables
To say you've successfully completed this lesson, you should be able to do the following:
- Use Excel to generate a table of values from an algebraic formula.
- Use Excel to graph those values as a scatter plot with smooth curves.
- Enter word equations in Maple to derive a symbolic equation.
- Use Maple to graph a function of one variable.
- Use Maple to differentiate.
- Use Maple to solve an algebraic equation in one variable.
These skills are what you'll need to complete the WebAssign homework for this Lesson.